We know your industry — and its buyers.
M&A is not industry generalism. Across our sectors we pool real transaction data, valuation benchmarks and a mapped buyer network — so you know what your company is worth and who would buy it.

Industrials & Manufacturing
Machinery & plant engineering, manufacturing, suppliers — IP, order backlog and production depth drive value.

Software, IT & Technology
SaaS, IT services, managed services — recurring revenue drives the highest multiples in the Mittelstand.

Business Services
B2B services, maintenance, facility, consulting — recurring revenue in an actively consolidating market.

Healthcare
Care services, practices, medical technology, labs — demographics-driven growth and predictable cash flows.

Consumer Goods & Internet
Brands, D2C, e-commerce, wholesale — margin, brand strength and channel mix decide the price.
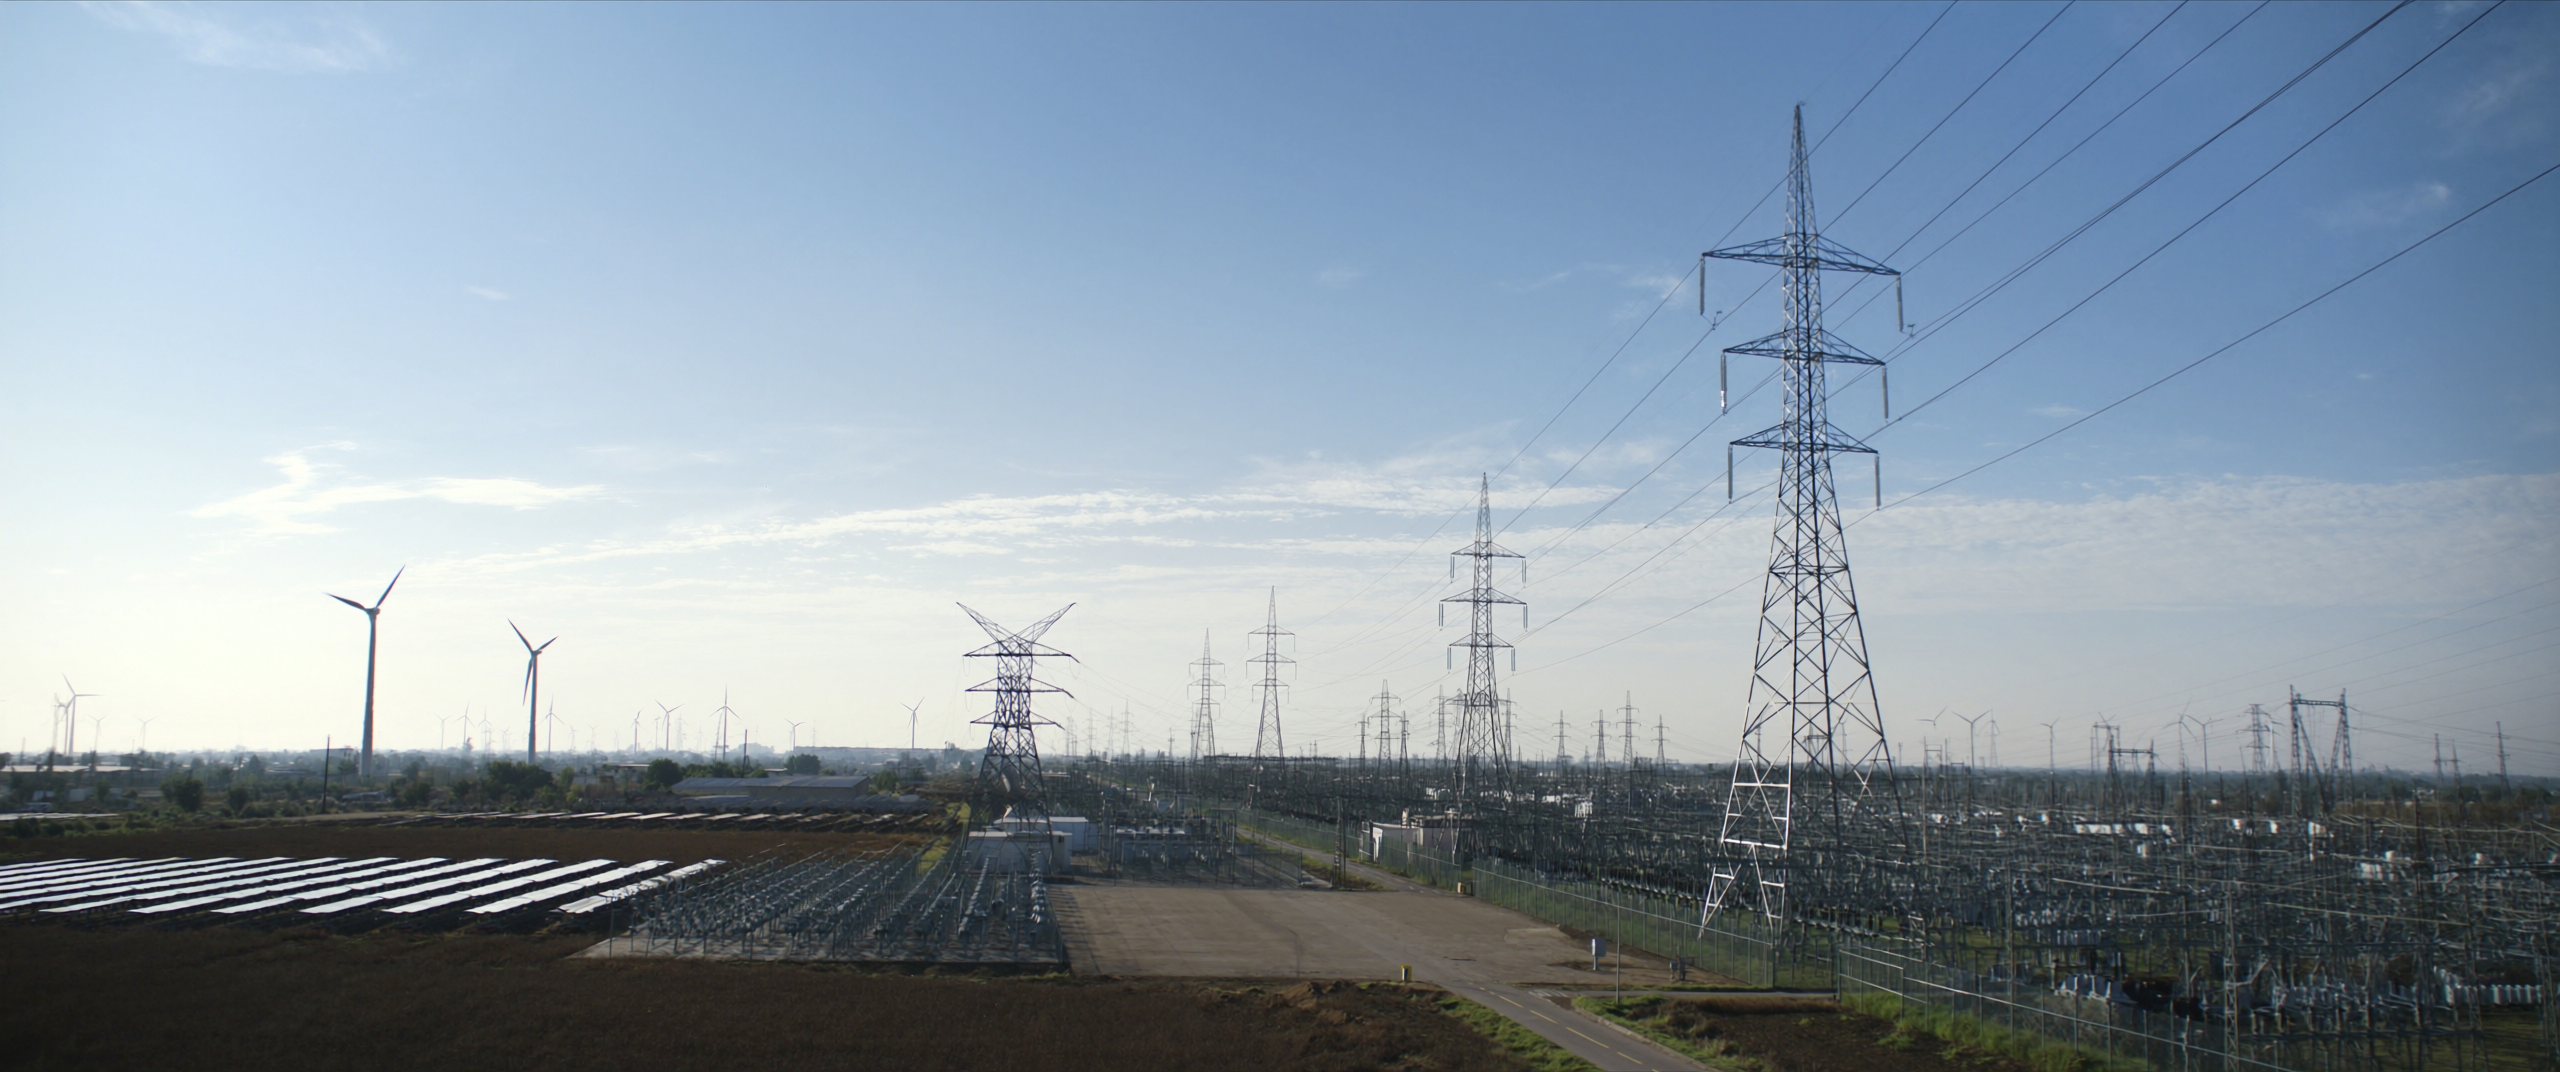
Energy & Infrastructure
Renewables, utilities, energy services — long-term, predictable earnings in a growth market.

Telecommunications & IT Infrastructure
Carriers, data centres, managed service providers — critical infrastructure with contracted revenue.

Chemicals & Pharma
Specialty chemicals, active ingredients, contract manufacturing — regulated markets with high entry barriers.

Environmental & Waste Management
Recycling, waste management, water, remediation — the circular economy on a municipal contract base.

Financial Services
Insurance brokers, financial distribution, fintech — recurring book revenue with high predictability.

Real Estate & Development
Property management, holdings, development — recurring management fees are valued far above project gains.

Logistics & Transport
Freight forwarding, contract logistics, warehousing — networks and customer contracts count for more than truck fleets.

Hospitality
Hotels, branded restaurant groups, catering — locations, concepts and staff structures set the price.

Security & Protection
Security services, fire protection, security technology — standing engagements with high client retention.

E-Commerce
Online retail, D2C brands, marketplace sellers — unit economics and channel independence decide.

Agriculture & Forestry
Agricultural operations, forestry, agritech — asset value meets long-term-minded buyers.

Media & Creative Industries
Agencies, production, publishing, gaming — retainer share and client retention beat project glamour.

Mobility & Transit
Public-transport operators, fleet operators, traffic services — concession-driven predictability.

Legal, Tax & Audit
Tax firms, audit practices, legal advisory — client retention as the valued asset.

Wholesale & Distribution
B2B trading, import, specialist distribution — assortment depth and supplier ties count.

Education & Training
Private education providers, professional training, e-learning — certified programmes with predictable participant flows.

Veterinary & Pet Care
Veterinary practices, animal health, pet food — emotional demand, professional consolidation.

Construction & Trades
Specialist construction, building technology, fit-out — order backlog and skilled workers are the real substance.

Automotive
Suppliers, aftermarket, retail & service — transformation creates risks and targeted buyers.

Retail
Specialist retail, branch concepts, stationary & hybrid — locations, leases and customer loyalty decide.
Skilled Trades
Electrical, plumbing & HVAC, roofing — the succession market with the strongest buyer interest in teams.

Beauty & Wellness
Studios, cosmetics, fitness — recurring memberships and brand loyalty count.

Events & Live Industry
Event, trade-fair and production services — framework agreements smooth the project business.

Funeral Services
Funeral homes and cemetery services — a dignified market with stable demand and active consolidators.
What industries cost today.
Median and typical range of the EV/EBITDA multiple per sector — from completed and observed transactions. The specific value depends on the size, growth and quality of your company.
Light marker = typical range (25th–75th percentile). Source: CARL market monitor Q2 2026.
Industry knowledge that shows up in the price.
Buyer network per industry
2,500 buyers — mapped by sector, size and strategy. We know who is currently buying in your industry and approach precisely the few right ones.
Multiples from real deals
Our benchmarks are built on actually completed transactions in the DACH Mittelstand — no estimates, no shop-window figures.
Sector deal team
Advisors who know your industry, its metrics and its buyers from dozens of mandates — from the first conversation to closing.
Not sure where you fit?
Many companies span several industries. In a 15-minute conversation we position your company, name the relevant range and the active buyers — free and confidential.